![Advertising Trends: CPM Benchmarks by Industry [Study]](https://static.semrush.com/blog/uploads/media/88/08/88084dec367a2a9f6ce1ca2881ffdd7e/45eaac9207cb53609be763aa9bde7fef/adclarity-data-study-3.svg)
It’s Advertising 101 to keep track of the effectiveness of your campaigns. Without a grasp of what’s working and what’s not (and why), you might as well be burning your money.
One tactic that can help you get there is a competitor analysis of the advertising landscape in your niche—and that’s what we’re here to help you with.
Via our partner app, AdClarity, we recently collaborated on a study of advertising trends across a variety of industries and have published two blogs on overall ad spend trends and the most popular ad types so far.
This third edition of the series delves into ad cost per mille (CPM), or cost per thousand impressions to help you benchmark your own campaigns against the competition.
From how to discover average levels of investment to where to look for performance metrics of ad campaigns, you’ll be able to pick your industry apart using AdClarity by the time we’re done here.
Not only that, once you’ve got a handle on AdClarity, you’ll also be able to pinpoint inefficiencies and, therefore, areas for improvement in your own campaigns as a result.
Let’s take a look at the average CPM in digital advertising for each industry and each content type to get you started.
CPM Benchmarking
The CPM on a given platform or channel is a great indicator of how successful an advertising campaign is in any industry. Once you know what high and low CPMs look like, you’ll be able to use the insights to guide your own campaign budgets in the future.
CPM certainly depends on a variety of factors and can differ from industry to industry, but that is precisely why we included it as a data point in this study. You’ll be armed with CPM insights and the ability to find them yourself in no time.
Our Methodology
Using data provided by AdClarity, we assessed a total of 956 domains from the top players in 13 industries in the US. This allowed us to analyze the CPM of ads and campaigns based on the estimated spend and impressions data in the study. The dataset covered display, social and video advertising during the period from January 2021 to May 2023.
Digital Ad CPM Benchmarks by Industry
Our first port of call was to determine the CPM of each selected industry. We ranked them by dividing total estimated spend by total estimated impressions x 1,000 and found that the Food Delivery industry came out on top with a CPM high of $7.63:

Key players in the Travel industry also found themselves having to pay over $7 per thousand impressions ($7.12), while those in Finance paid an average of $6.52.
Companies in the Dating and Media industries had the lowest CPMs of $4.44 and $4.27 respectively. They also relied more on in-app ads than they did on desktop ads, which suggests the former could have been a cost-effective channel for them during the selected timeframe.

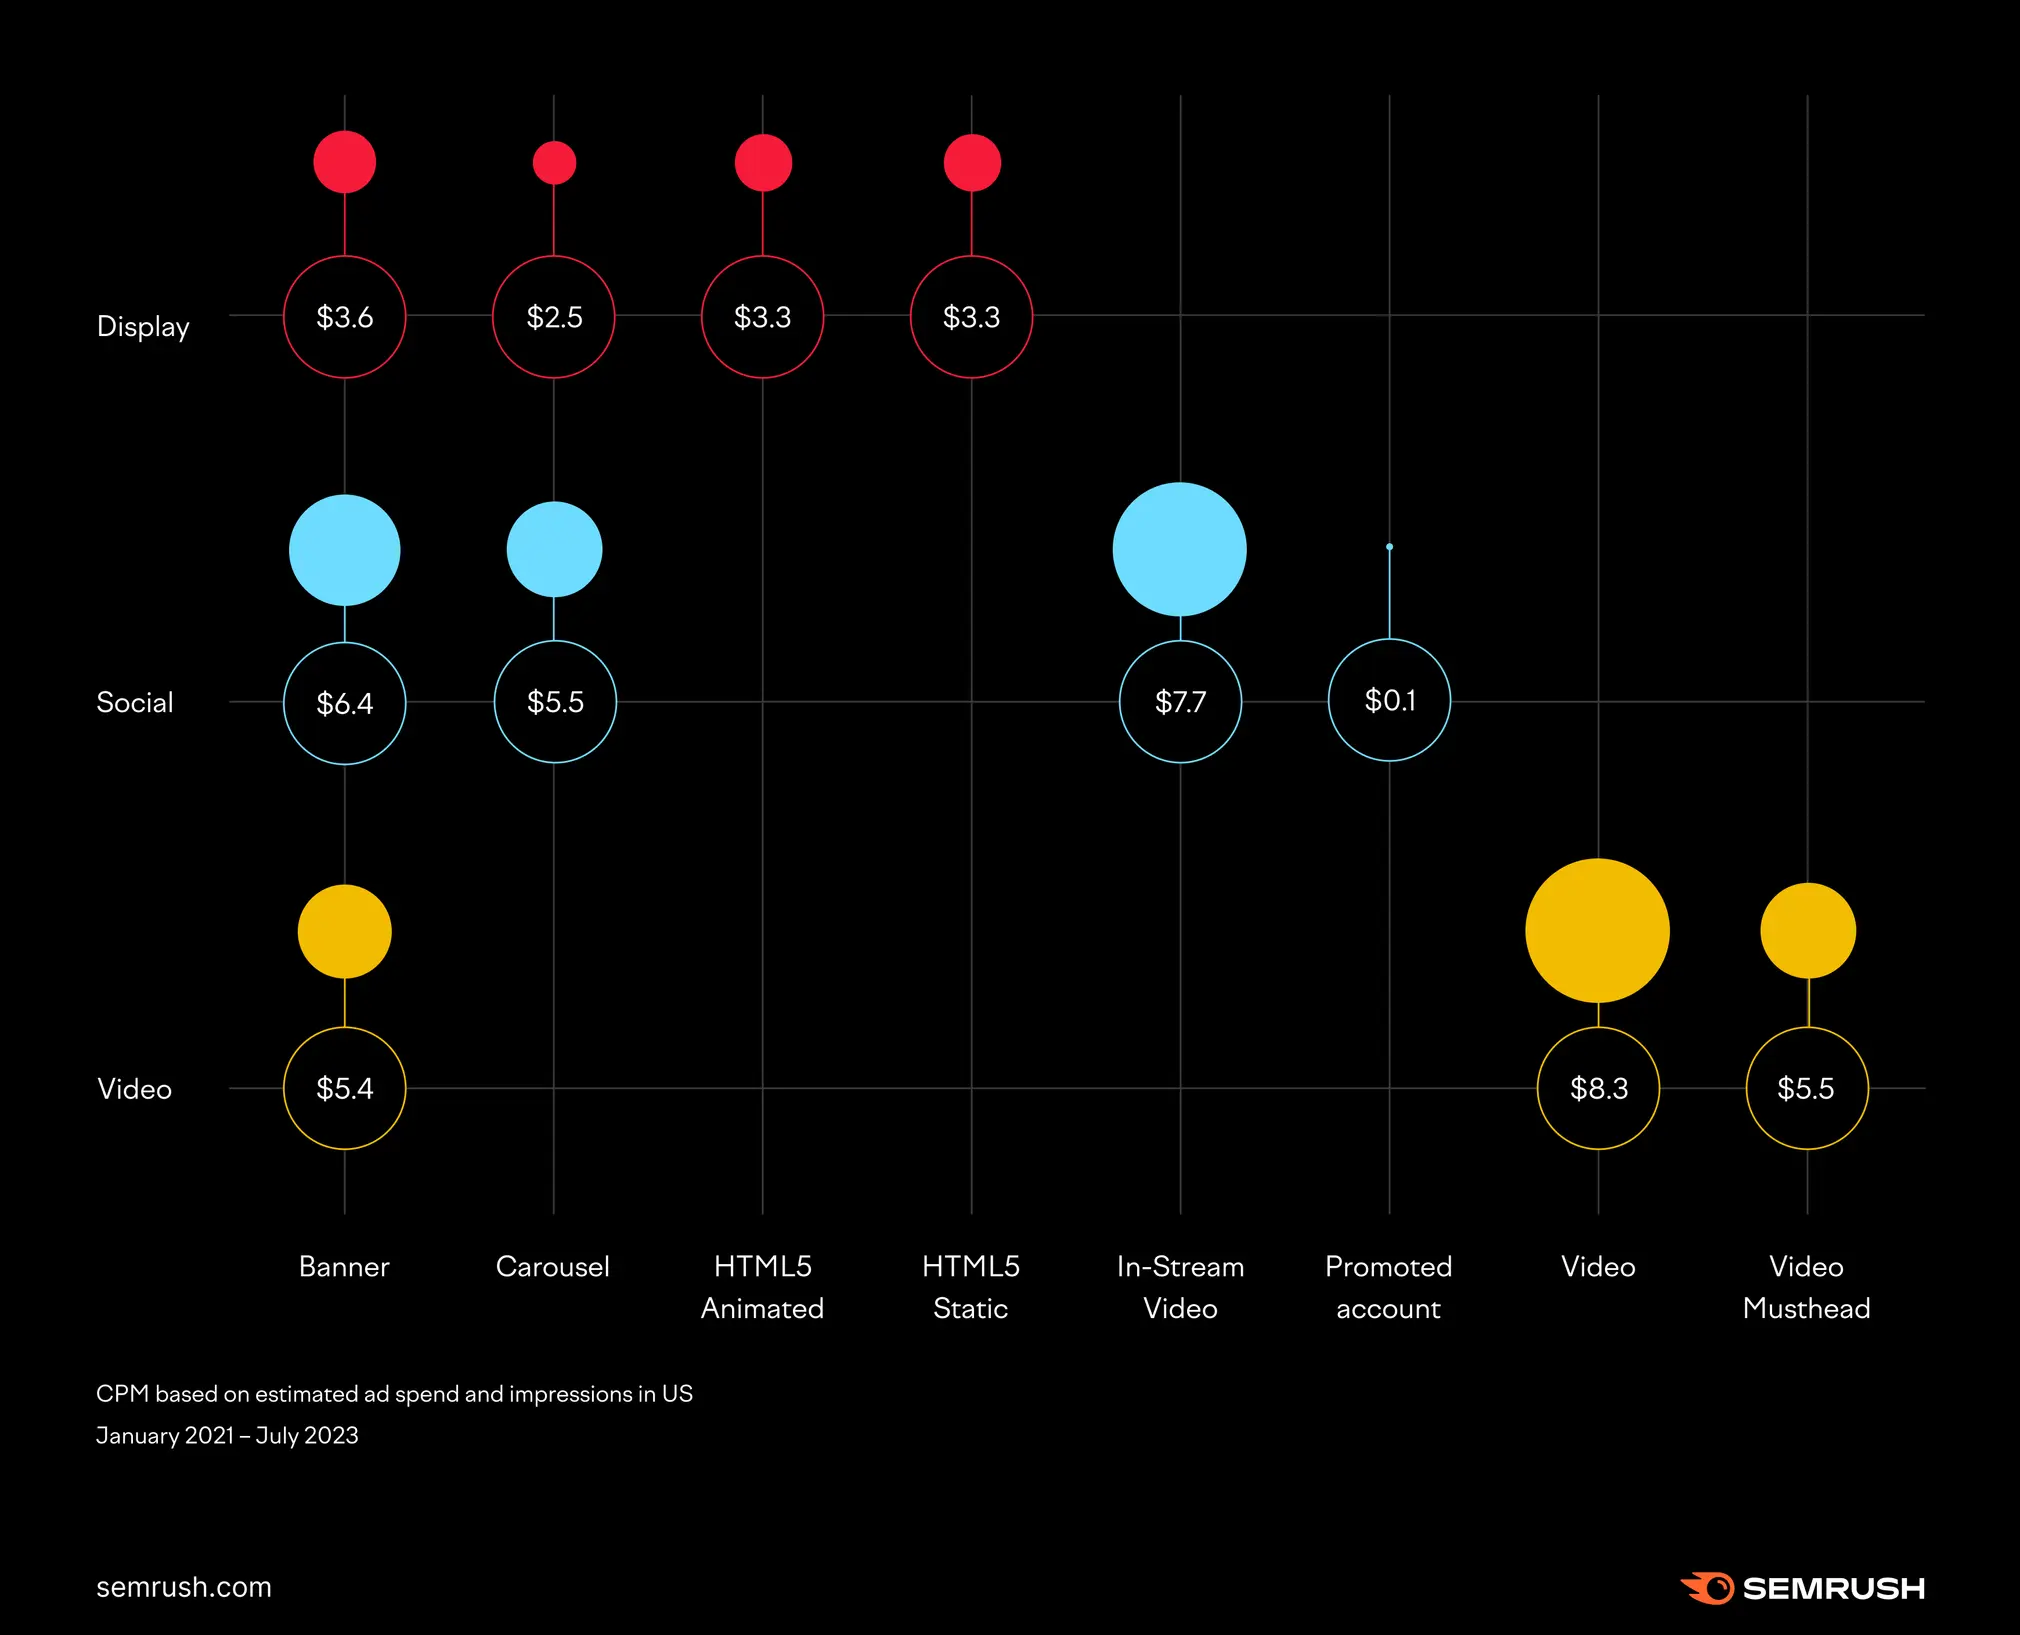
Digital Ad CPM by Ad Type
When we take a look at CPM per content type, we see that video was easily the most expensive format. Mobile videos in particular came out with a CPM of $11.10, while in-app and social videos all set advertisers back $9 or more per thousand impressions.
Contrastingly, display ads on desktop turned out to be the most affordable on average for the domains in our study at a CPM of only $2.50:

If you’re planning your budget in just one channel, here’s another look at the CPM benchmarks for ad types in each channel:
Justifying the cost of including video in your advertising strategy is no mean feat, especially in light of the recent controversy concerning Google and YouTube’s skippable ads.
It’s crucial to keep a close eye on how your budget is performing and whether or not you’re utilizing the right content formats—be sure to conduct regular audits of video performance to understand its true value to you.
Are you getting enough reach and engagement out of your ads?
Do you have a good CPM in relation to the rest of your industry? Could less expensive formats like desktop and in-app display ads be a better fit for your online advertising needs?
How to Check Your Competitor’s CPM
One of the great benefits of AdClarity is that the insights don’t stop at an industry level—you can dig into competitors, campaigns and even individual ads to benchmark your own activity, whether you need a Facebook/Meta CPM benchmark or a Google display CPM benchmark.
You can unveil the advertising secrets of your competition and estimate their CPM by dividing their campaign spend by their campaign impressions.
All you need to do in AdClarity is enter their domain and scrutinize the report to see the statistics—you’ll find the estimated spend for the chosen timeframe at the top of the page:

So, with a total of 13M impressions and a spend of $61.5K, this advertiser had a CPM of around $4.73 here. If you scroll further down the report, you get insights into spend and impressions by channel:

By ad:

By campaign:

And by publisher:

You can even see which methods they used to buy their ads:

The invaluable insights you can get from AdClarity can be the difference between flying and falling in the advertising world.
You can not only use this data in the planning and strategy phases of your campaigns to properly benchmark your activity, but also during and after campaigns to understand how your ads resonated and, of course, what might need tweaking along the way.
If it’s digital advertising intelligence you’re looking for, you’ve come to the right place—check out AdClarity in Semrush’s App Center here today.