If you have purchased .Trends, you have access to the Subfolders report within Traffic Analytics. The Subfolders report looks at which subfolders on a competitor’s website are responsible for generating the most traffic.
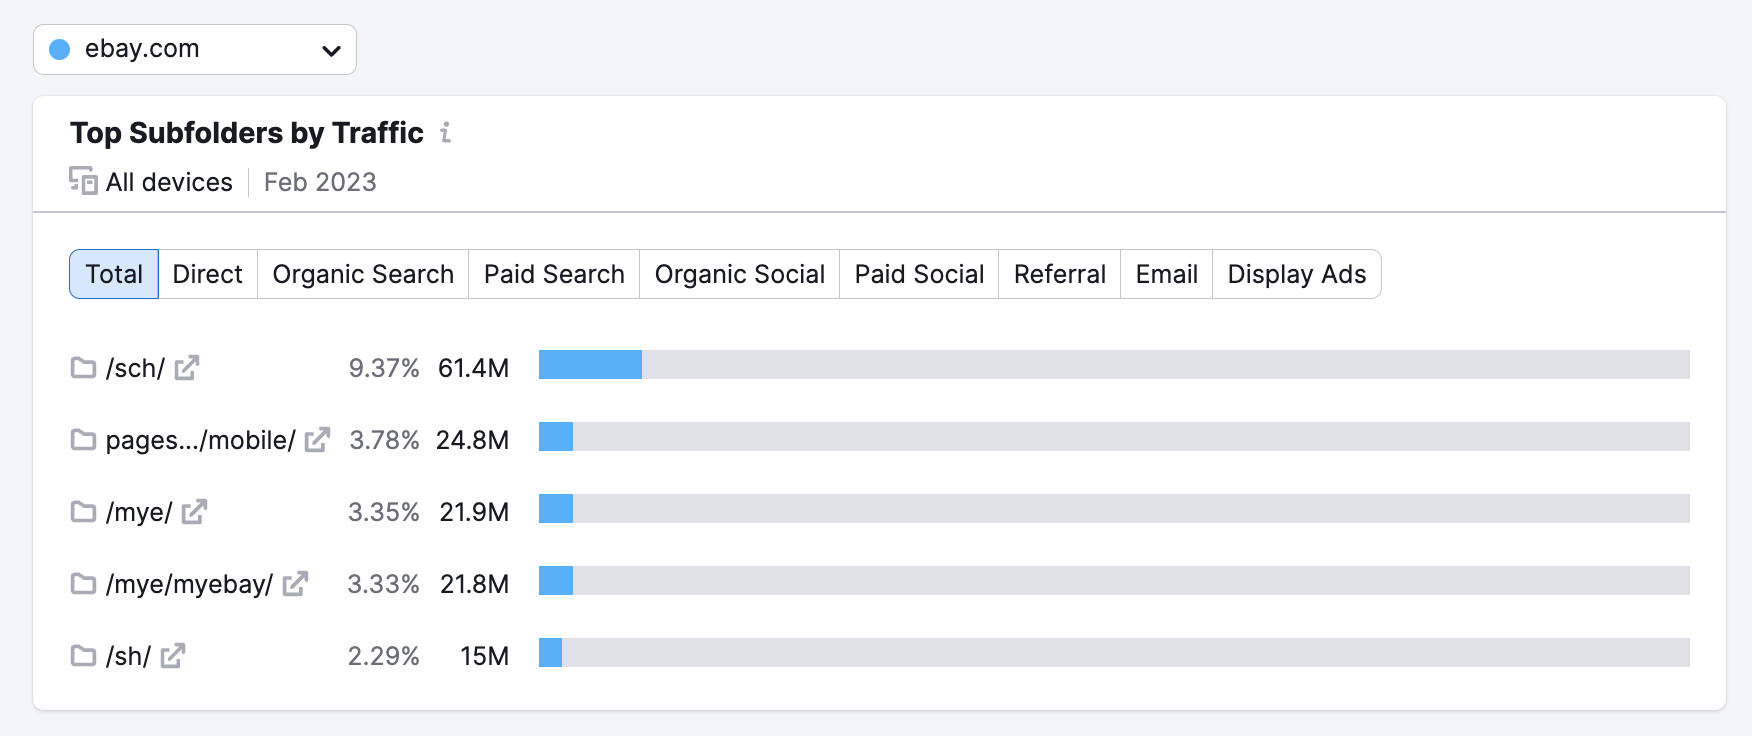
At the top of this report, the Top Subfolders by Traffic widget breaks down the top five subfolders according to the amount of traffic they received during the previous month. You have the option to view this in Total, or to look at traffic from an individual Entrance Source (direct, referral, organic social media, paid social media, organic search, paid search, email, and display ads). You can toggle between each option by clicking on the one you want to view.
Next, the Subfolders table breaks down each subfolder’s respective traffic into eight major factors, which are displayed in twelve columns:
- Traffic Share: The percent of visits to the domain that come to this subfolder
- Unique Pageviews: The number of visitors to the domain that came to this subfolder at least once
- Unique Visitors: The total number of visitors that came to this subfolder
- Pages/Visit: The average number of pages a single visitor browses within this subfolder during a single visit
- Exits: The number of unique sessions that came to an end on a listed subfolder or one of its pages
- Average Visit Duration: How much time the average visitor spends browsing this subfolder
- Bounce Rate: The number of visitors that left this subfolder after viewing only one page
- Entrance Source: The number of visitors driven to this subfolder by five source types (direct, referral, organic social media, paid social media, organic search, paid search, email, and display ads). This is broken down into five color-coded columns.
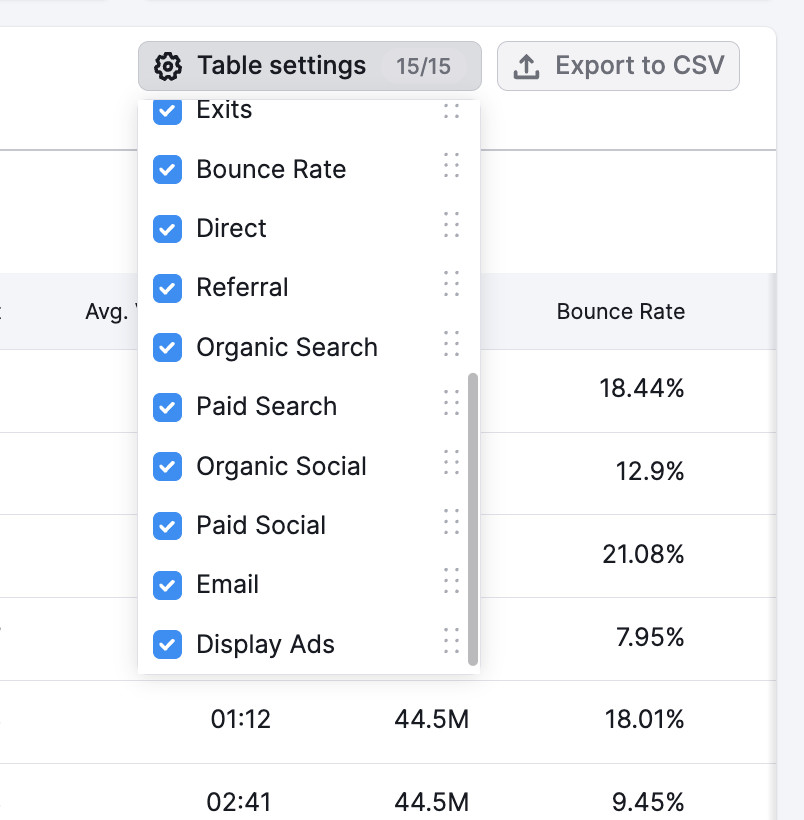
You can customize this table by choosing which columns you want to view or hide. Select “Table Settings” and deselect any columns you do not wish to see. You can also click “Export” to download this information as CSV or Google Sheets file.
Analyzing Individual Subfolders
In addition to taking a bird’s eye view of all of an analyzed website’s subfolders, you can also examine an individual subfolder in detail. You can access this report by clicking on the subfolder you’re interested in learning more about from the Subfolders table to expand it.
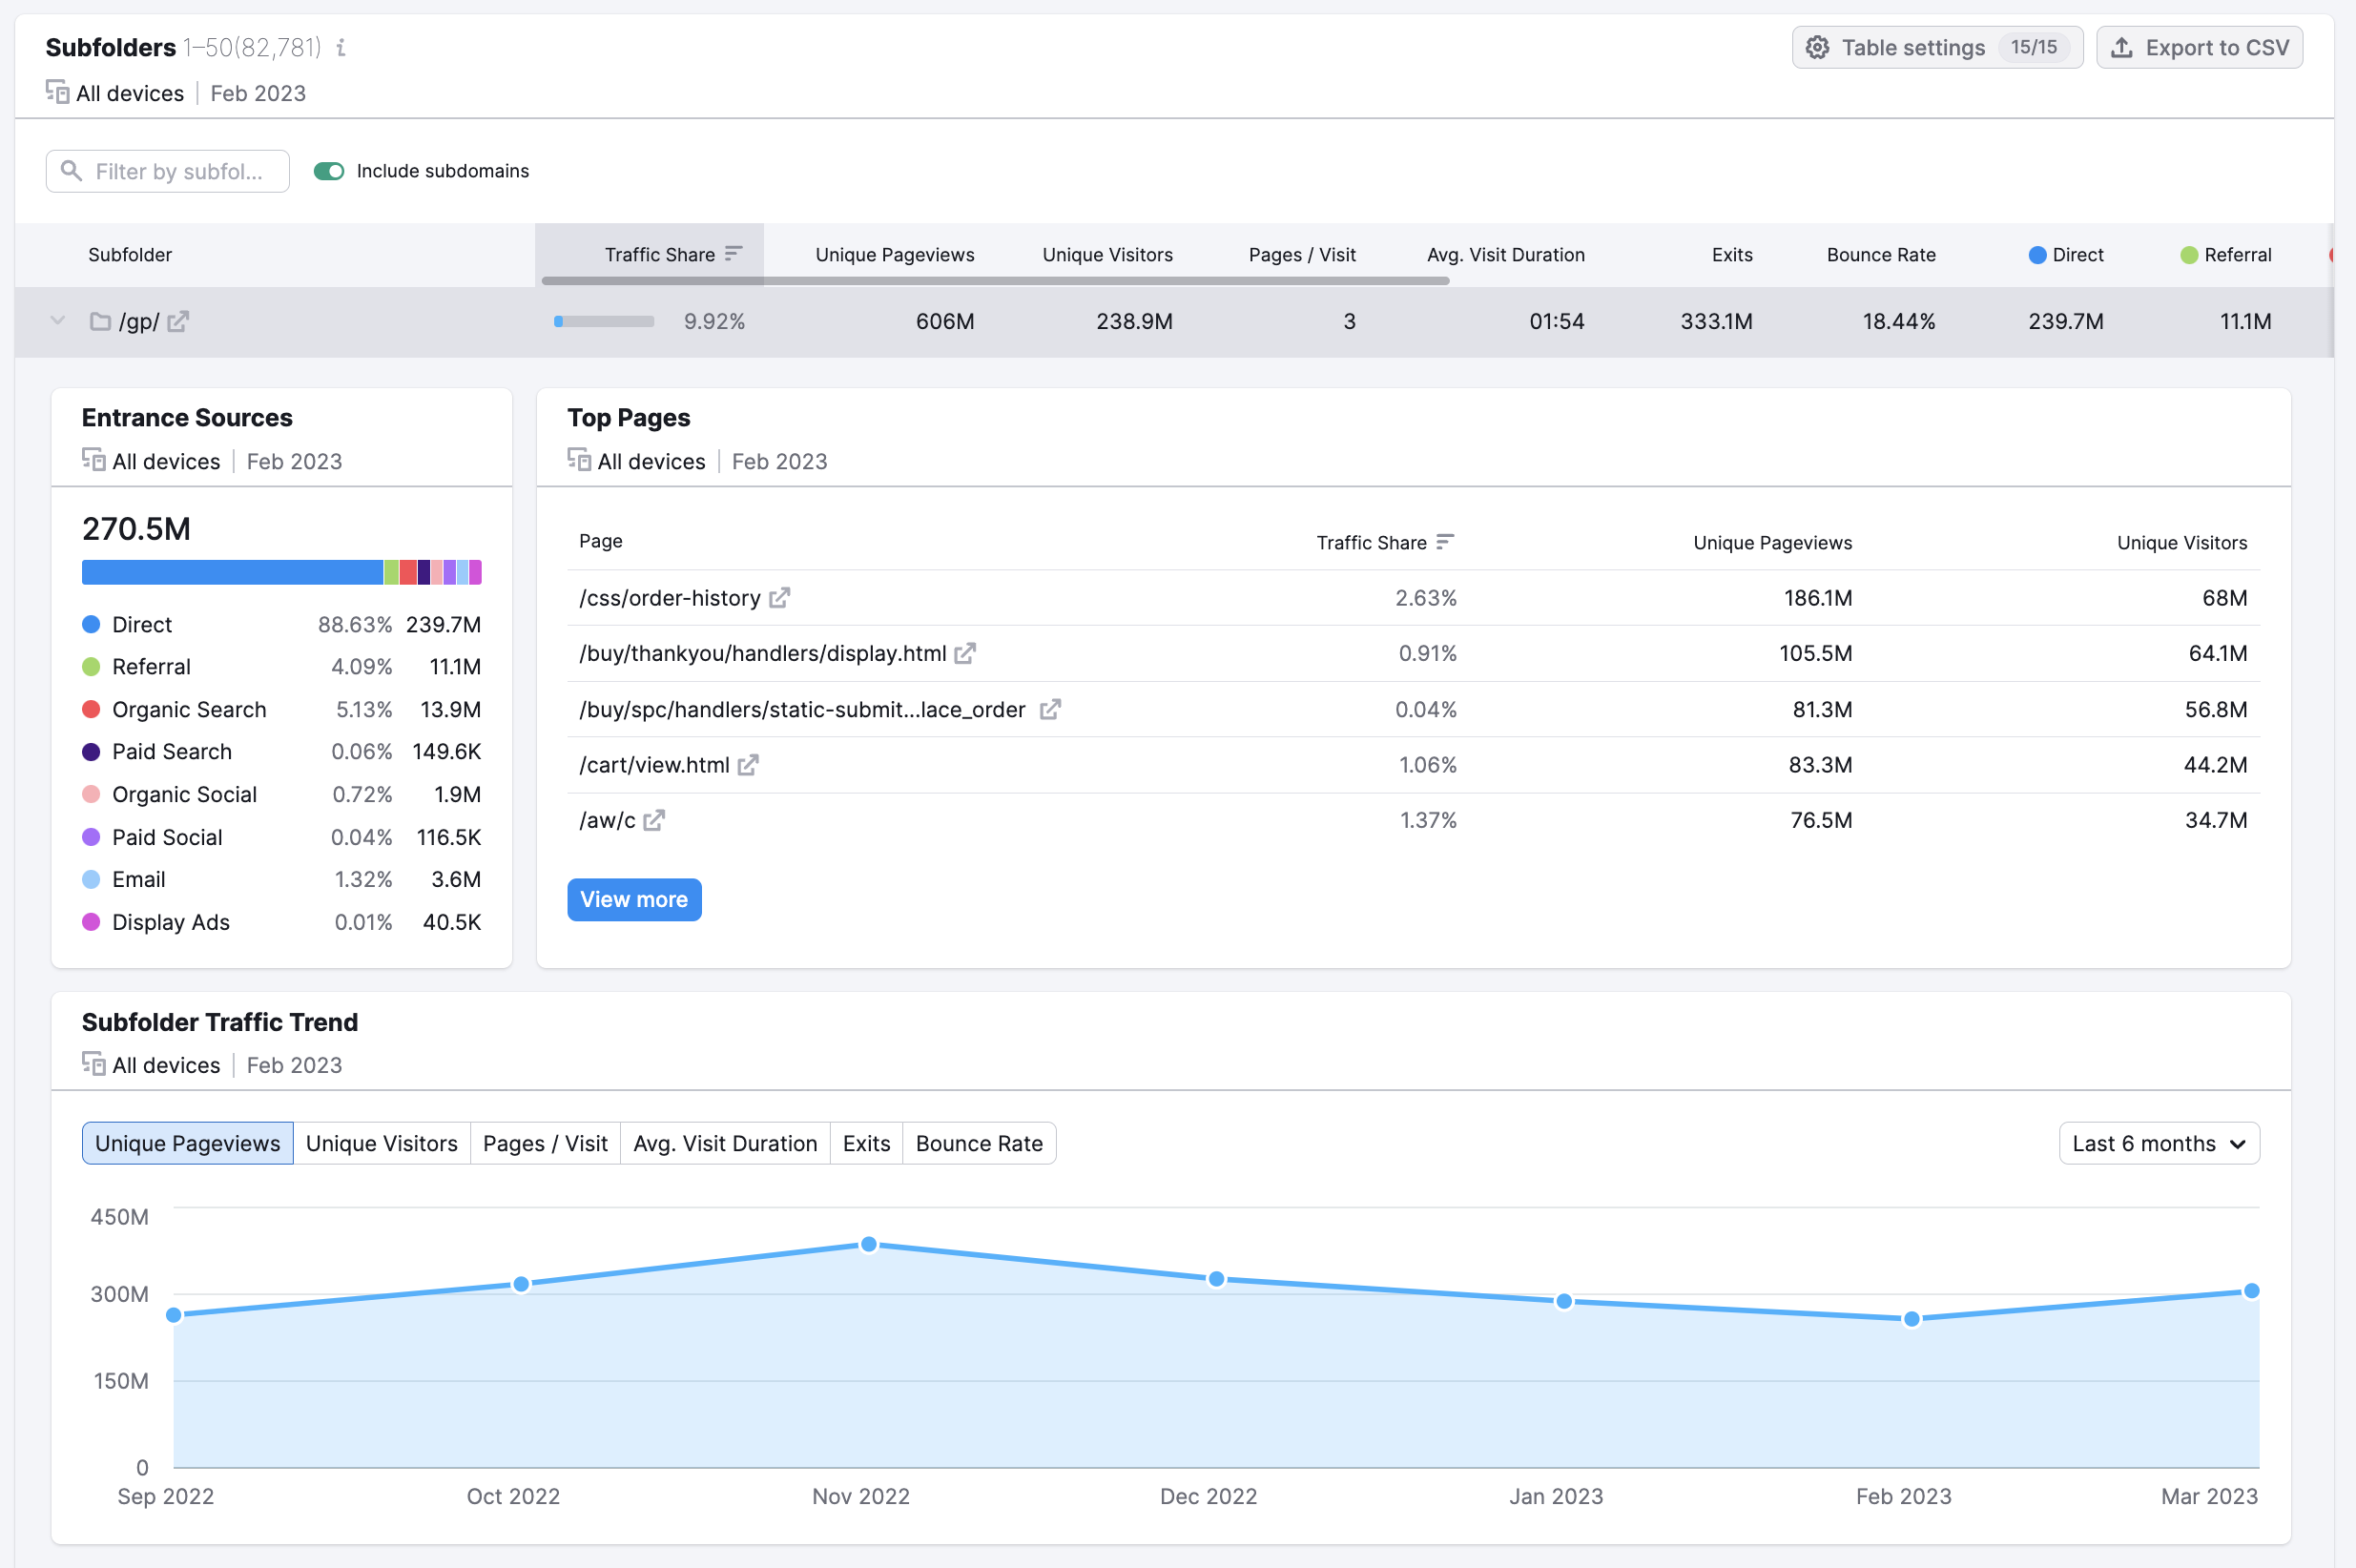
Here, you can see three widgets breaking down that individual subfolder’s overall performance.
- Entrance Sources breaks down the number and percentage of visitors that entered the folder via direct, referral, organic social media, paid social media, organic search, paid search, email, and display ads during the previous month.
- Top Pages shows you which pages within that subfolder have generated the most unique visitors and pageviews during the previous month. If you click “View more,” the Top Pages report will open in a new window.
- Traffic trend displays the changes in traffic trends for this folder over the past six months, twelve months, or all-time. You have the option of viewing Unique Pageviews, Unique Visitors, Pages/Visit, Average Visit Duration, or Bounce Rate. You can toggle any of these options by clicking on the ones you want.