The Idea Tasks report in On Page SEO Checker is where you follow the progress of your SEO improvements over time. You'll see a bar graph to measure the trend of your progress and a table below lists all of your ideas with either a “To do” or “Done” status.
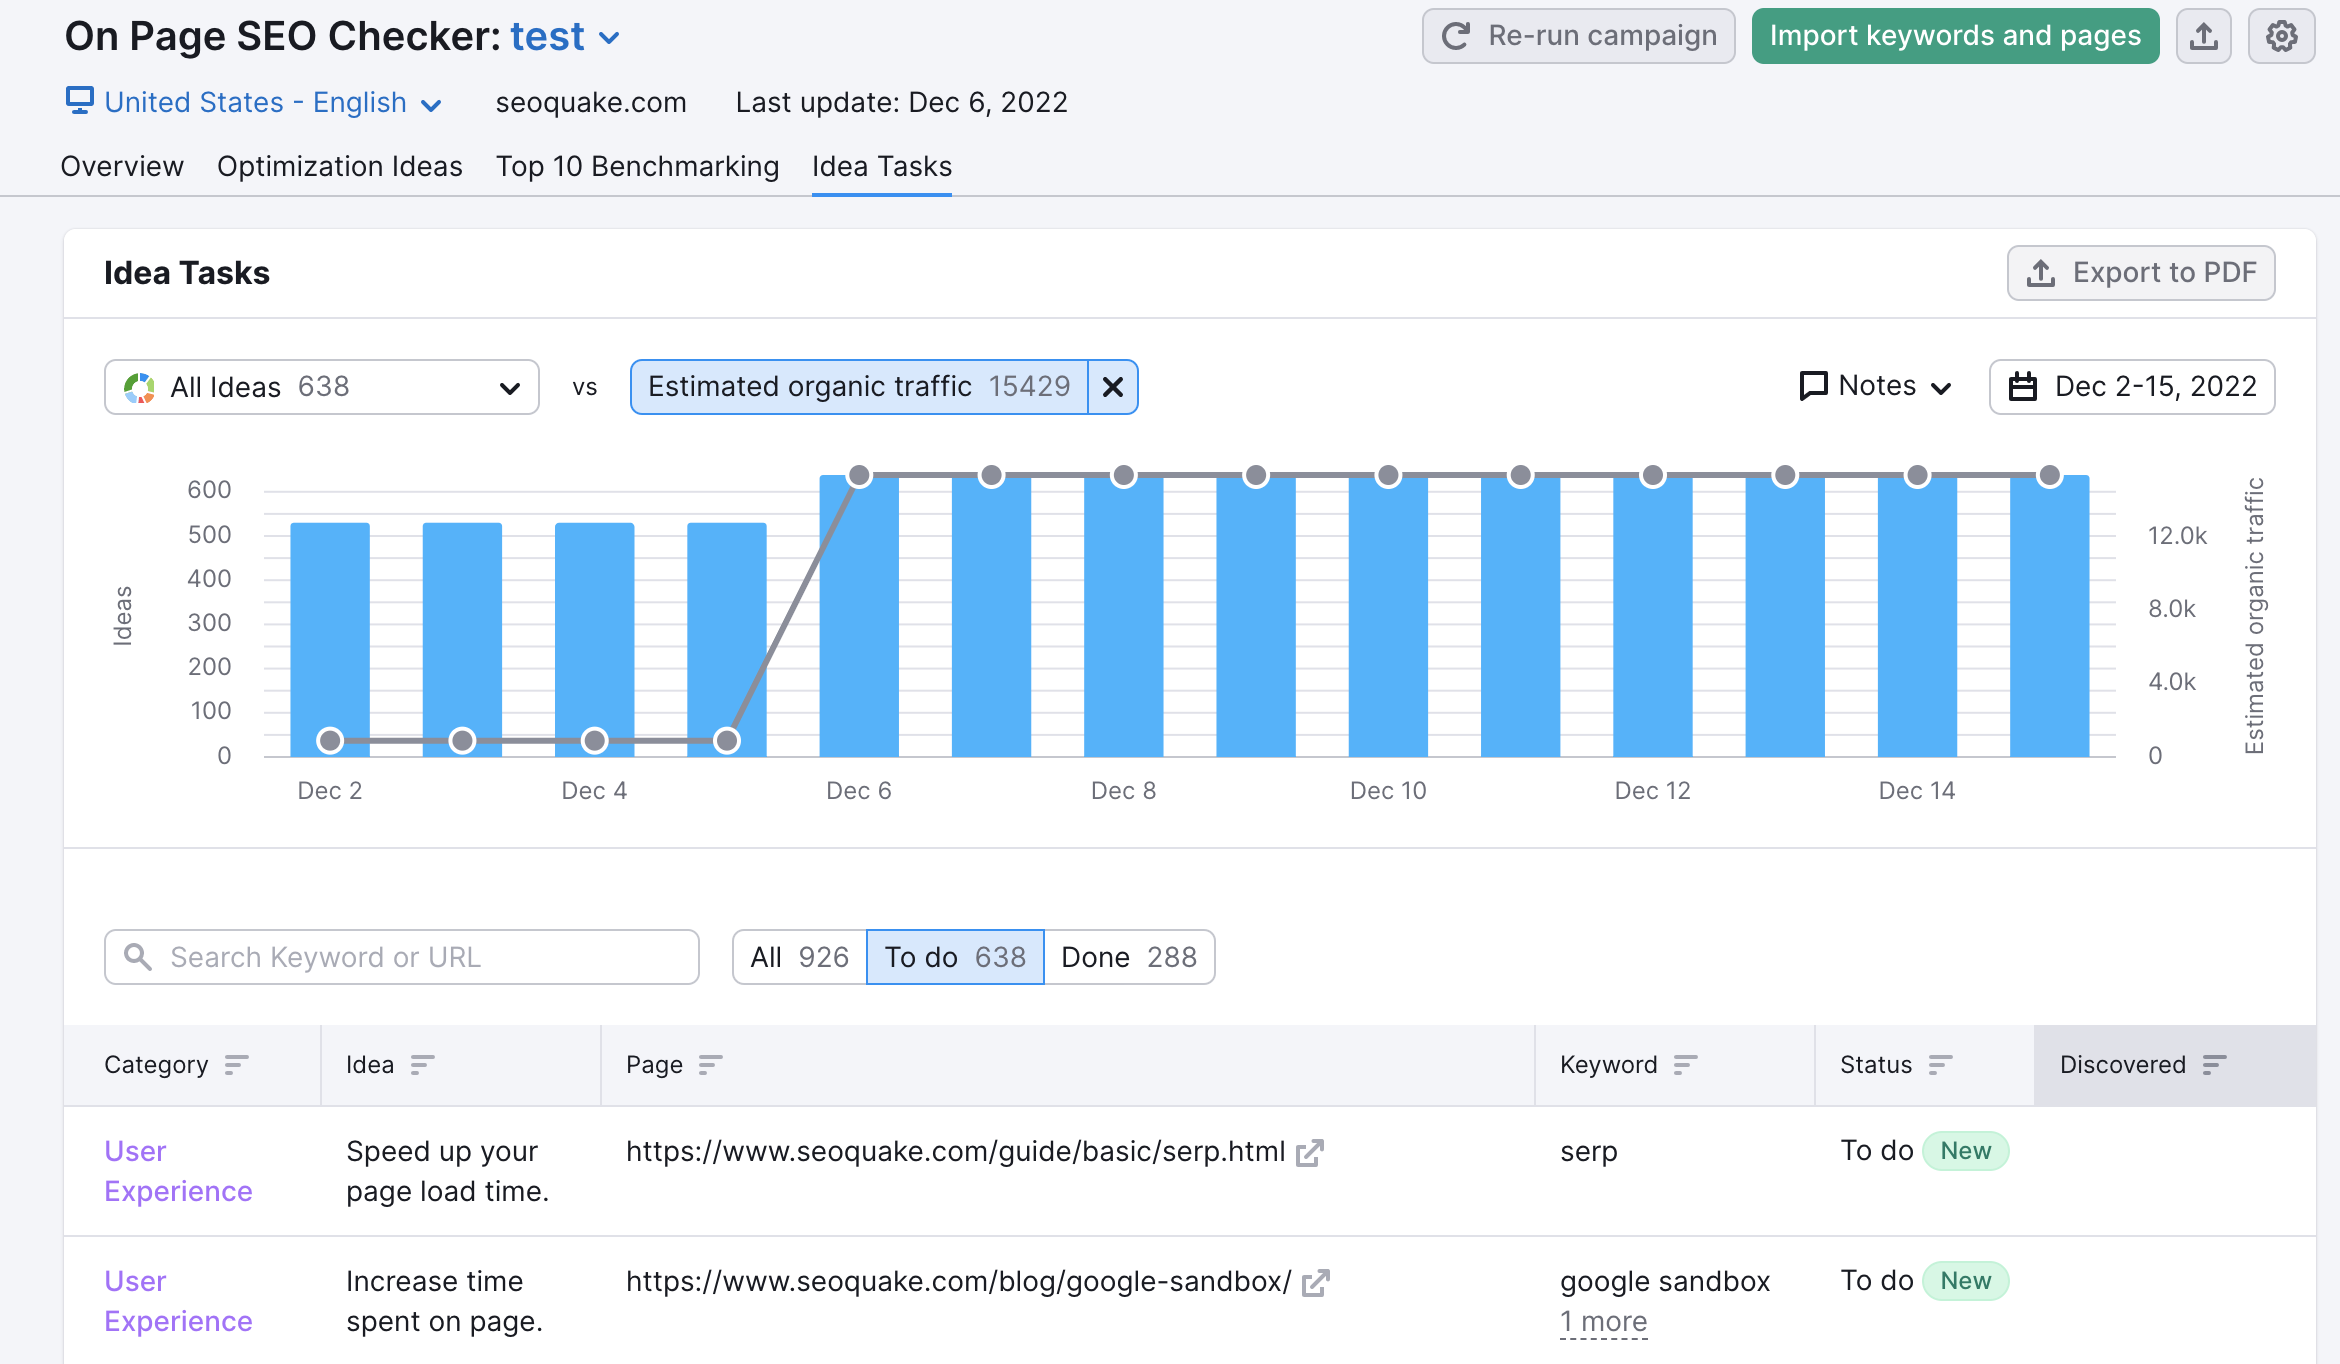
The line in the graph measures the number of ideas suggested by SEMrush, and the bars measure your comparison metric. You can change the comparison metric between the number of pages, the number of keywords or estimated organic traffic to hone in on how well your efforts are in each category of SEO.
You can customize the graph by changing the parameters of the bars and lines and also by adjusting the date range with the dates at the top right of the graph.
You can also add notes to your graph using the red diamond icon next to the calendar drop-down. Here is where you can write reminders and keep track of important campaign dates on the same graph as your SEO progress. Users can find their complete list of notes in the Notes list within the User Profile menu.
The table below shows all of your ideas and breaks them into separate lists for "To do" and "Done" to indicate their progress. As you implement your ideas on your site, you'll see these ideas automatically move from the "To do" column to the "Done" column when you rerun the tool. Your ideas could also move from “To do” to “Done” because of a change in your top 10 rivals, or if you edit keywords or landing pages.
The table can be sorted by category of ideas, idea, URL (page), keyword, status, and date of discovery (when Semrush found the new idea or when it found that it was done).
Export your progress to PDF
This report can be exported to a PDF as a way to save your to-do list (just select the "To do" filter before exporting), or as a way to present the work that you've completed to a client (select the "Done" filter before exporting).
If you haven't refreshed your campaign in a while, this tab may be new for your campaign and will not yet have any data. In this case, you will have to rerun the campaign and collect new ideas to see the chart.