After finding the location of your business, you’ll be able to see an overview of your locations within the Local Dashboard. This section will show you how well all your connected businesses perform in local search.
You can group multiple locations into a Location Group, which allows you to view the aggregated performance of all locations within that group. Clicking "View locations" on a group card will expand it to show an overview of the individual locations it contains.

Clicking on an individual location or a location group will take you to its specific dashboard, where you can see the Growth Progress overview and Growth Actions.
Growth Progress
The Growth Progress widget shows the number of user interactions with your business profile on Google (website clicks, calls, messages, bookings, directions) (GBP Interactions) and the number of new reviews (Reviews).
By default, the Growth Progress graph automatically compares the current year’s performance to the previous year’s.
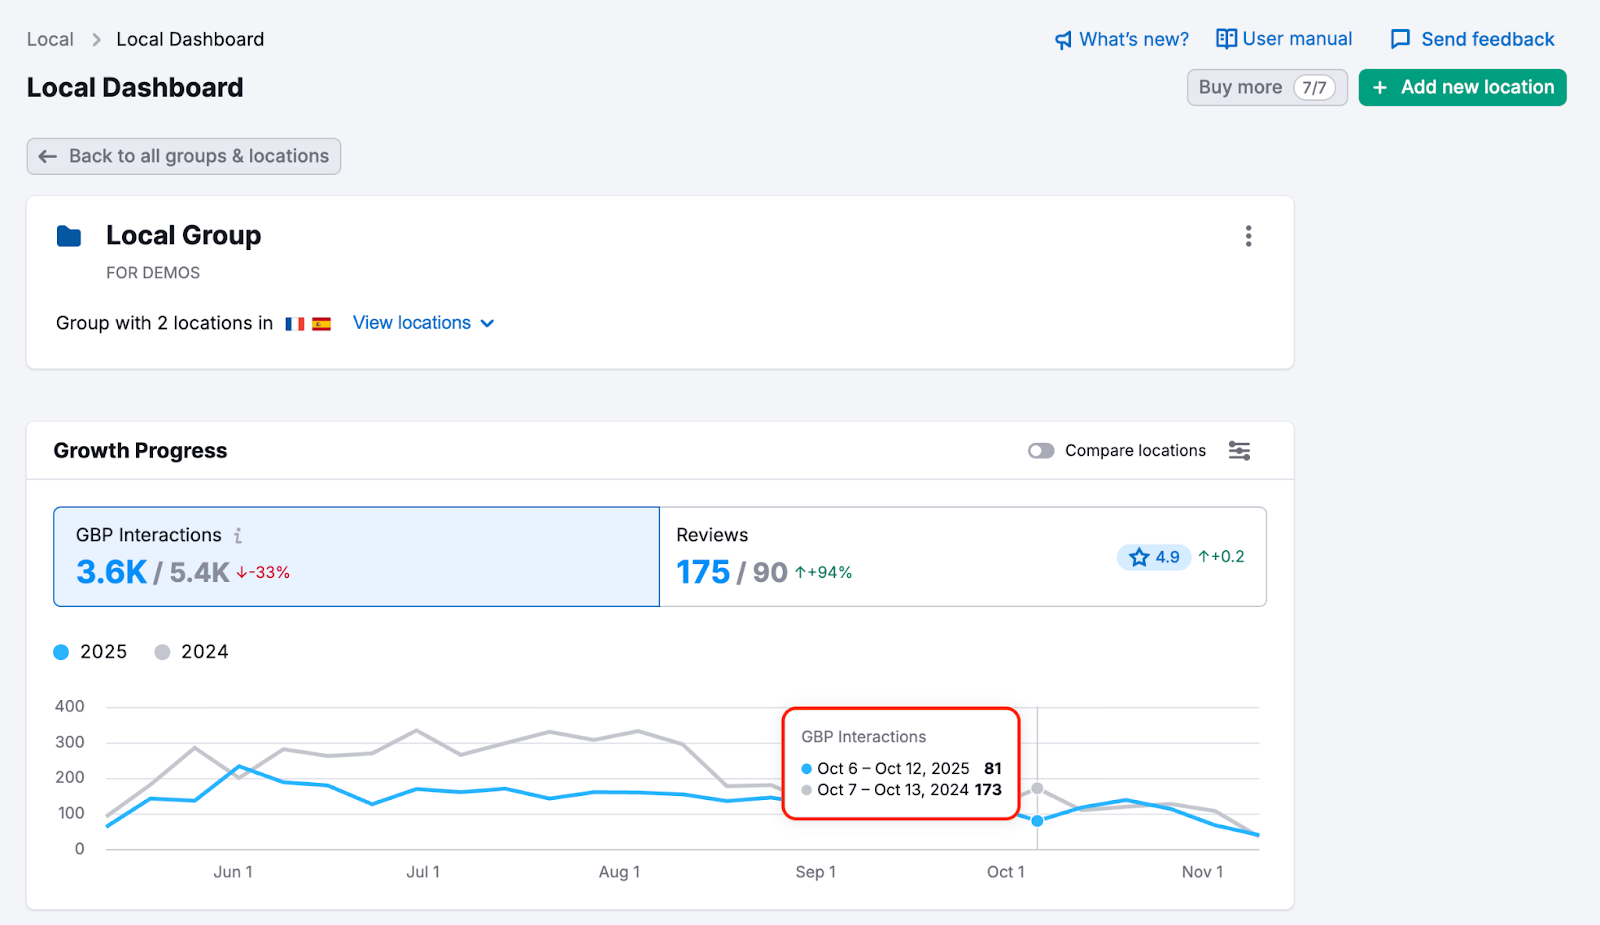
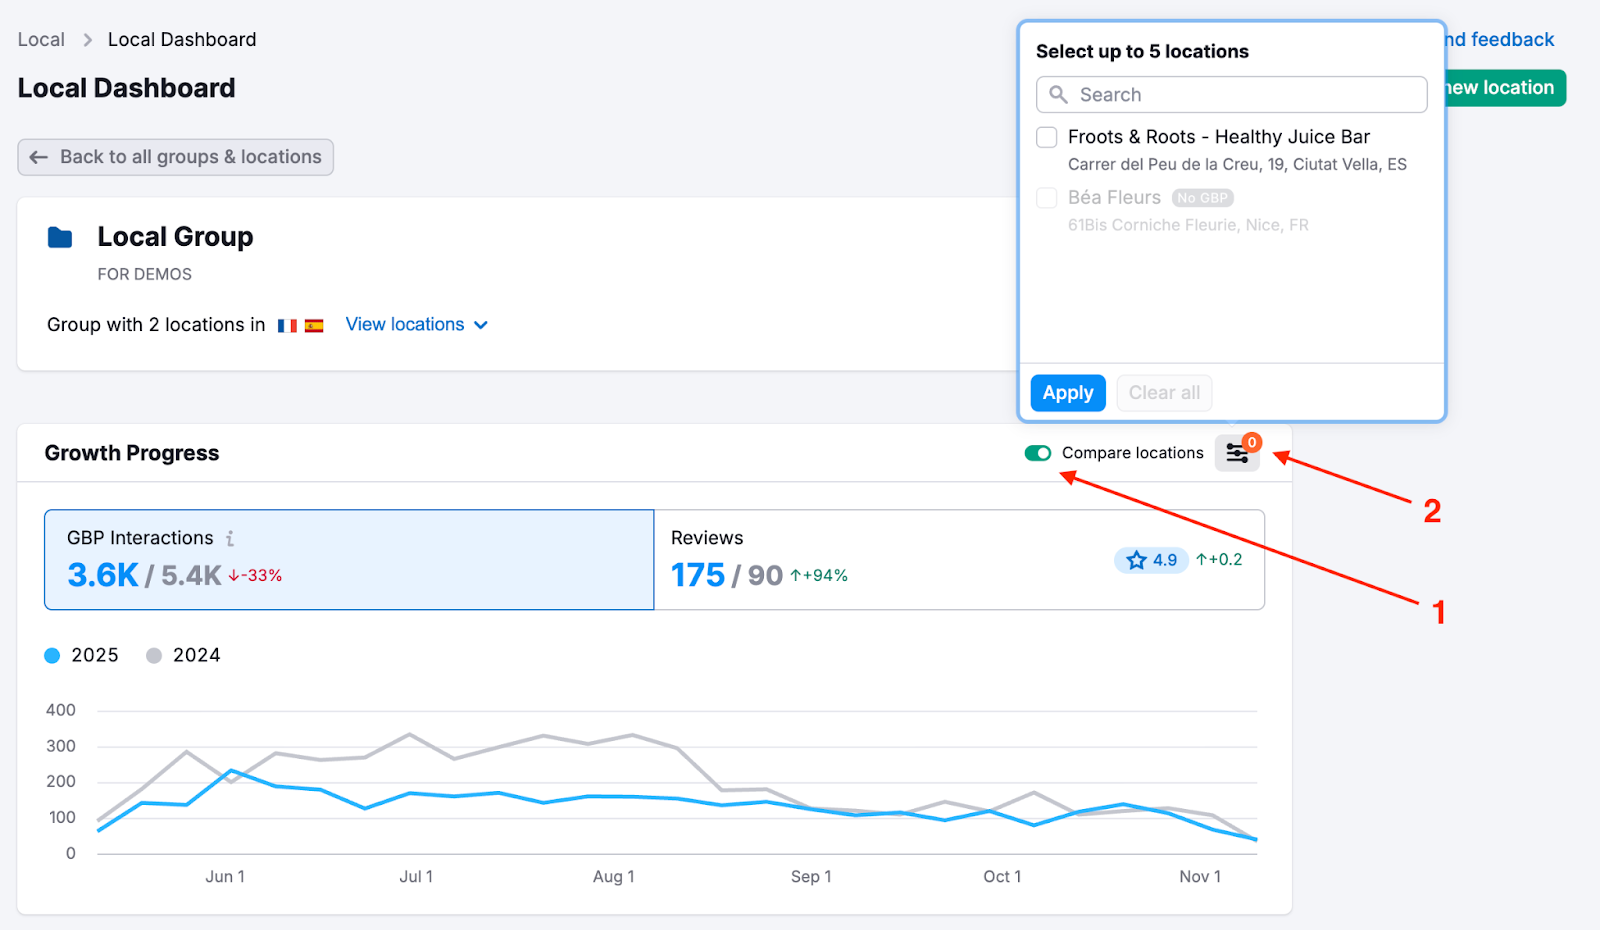
When viewing the Growth Progress for a Location Group, you can use the "Compare locations" toggle. This allows you to select up to 5 locations within the group to compare their performance metrics side by side in the graph.
Growth Actions
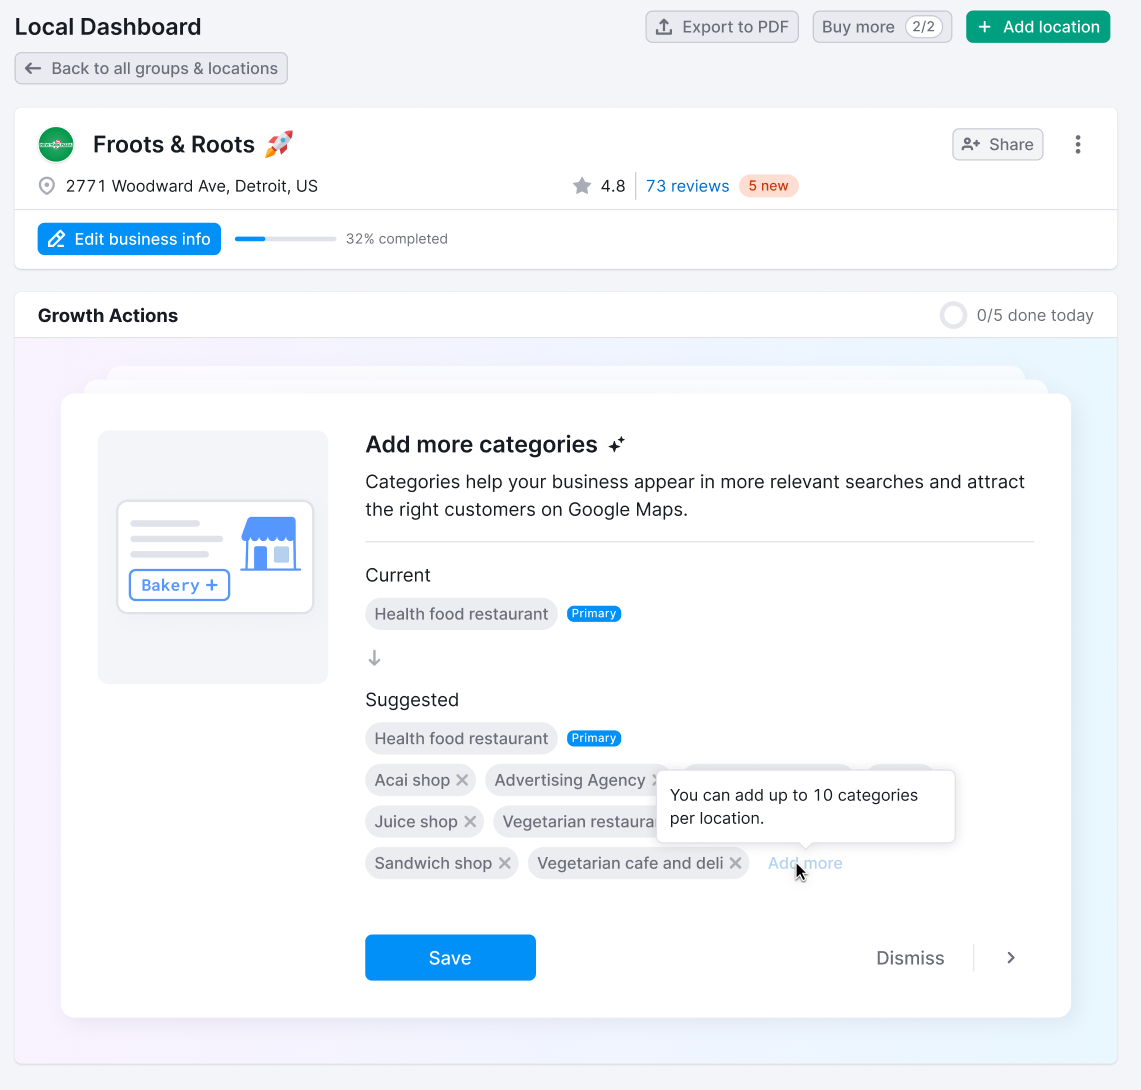
This section offers recommendations on enhancing your local online presence. These Growth Actions are sorted according to their priority and importance for improving your local visibility. To make the optimization process faster, many actions provide specific suggestions.
 돌아가기: Semrush Toolkits 카테고리